Services
Dashboards and KPI reporting
We connect your data sources and build dashboards that answer real management questions: what is happening today, where are we against plan, and what needs attention now.
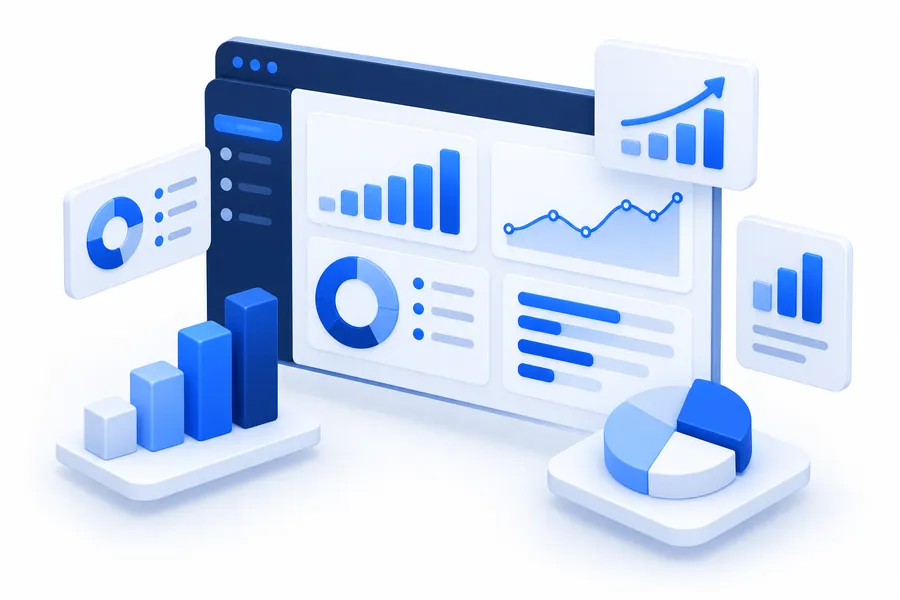
Reports that arrive too late
In many companies, the monthly report is assembled by hand from several exports and is out of date by the time it reaches management.
Good dashboards are not about more charts. They show a few agreed indicators, updated automatically, with the ability to drill down to the detail behind any number.
What we build
Management dashboards
Sales, costs, margins and cash on one screen, updated automatically.
Operational dashboards
Daily performance for production, warehouse, transport or service teams.
KPI frameworks
Help defining which indicators matter, how they are calculated and who owns them.
Scheduled reports
PDF or Excel reports sent automatically by email to the right people.
Alerts
Notifications when an indicator crosses a threshold.
How it fits together
Connects to
- Accounting and ERP
- Operational systems
- Spreadsheets
Data model and dashboards
Used by
- Management
- Team leads
- Scheduled reports
Typical features
Analysis
- Drill-down from total to detail
- Comparison with plan and previous periods
- Filters by period, region, team or product
Access
- Each user sees only their area
- Works on phone and desktop
- Export to Excel and PDF
Data
- Automatic daily or hourly refresh
- Single definition for every indicator
- Data quality checks
Typical scenario
An illustrative example of the kind of project we build, not a description of a specific client.
Situation
A company with several branches receives monthly results three weeks after the month ends, built by hand from different files.
What we build
A data model that collects figures from accounting and operations every night, and a dashboard with results by branch, comparison with plan, and drill-down to the transactions.
Result
Results visible the next morning instead of weeks later, and one shared version of the numbers.
How the project runs
Questions first
We start from the decisions you need to make, not from the available data.
Data sources
Connect and clean the data, and agree on the definition of each indicator.
Prototype
A first dashboard on real data, reviewed with the people who will use it.
Refine and automate
Final layout, automatic refresh, access rules and alerts.
Adoption
Short training and adjustments after the first weeks of use.
What you receive
- Live dashboards with access rules
- Documented indicator definitions
- Automated data pipelines
- Scheduled reports
- Source code and the rights to it
Technologies we use
- PostgreSQL
- Data pipelines (ETL)
- Metabase, Power BI or custom dashboards
- Python for data processing
- Scheduled jobs
Questions about this service
Do we need a data warehouse?
Not always. For many companies, a well-designed reporting database is enough. We size the solution to your data.
Can you use Power BI?
Yes, if you already use it. We can also build dashboards inside your own system or with open-source tools.
How fresh is the data?
As fresh as the sources allow: from near real time to a nightly refresh, depending on need.
Our data is messy. Is that a problem?
It is normal. Cleaning and defining the data is part of the work, and often the most valuable part.
Related services
All services-
Integrations and APIs
Your systems connected, so data moves automatically instead of being retyped.
-
Custom software development
Internal systems, portals and apps built around the way your company actually works.
-
AI automation and AI agents
Documents, data entry, answers and reports handled by AI, with people in control.

Let's talk about your project
Describe what you need in a few lines. We reply within one business day with questions and next steps.
Request a quote